
Help
This mutation portal provides an interactive interface to predictions by CHASMplus. CHASMplus is a machine learning algorithm that discriminates somatic missense mutations as cancer drivers. We summarize results with interactive widgets, provide search capability and an interactive table of results. Visualizations include:
- Mutations on protein structure
- Lollipop diagrams
- Number of driver mutations per gene
- Breakdown of mutation frequency
- Distribution of CHASMplus scores
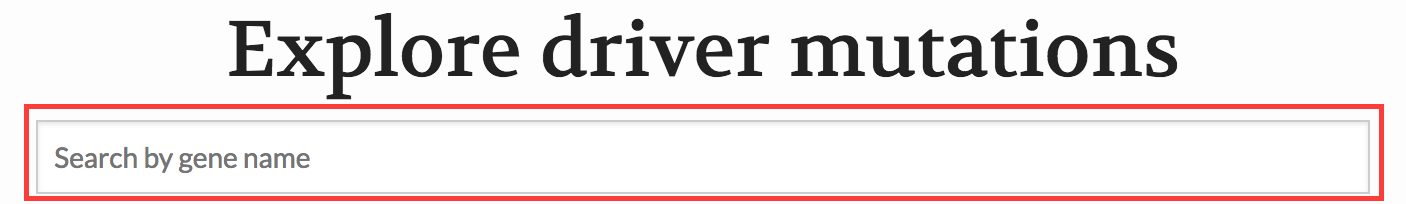
Search by gene
Enter in the HUGO gene symbol at the top of the page to search for all predicted driver mutations for a particular gene.
Summary plots
All searches will dynamically change the summary plots.
Table
The table provides a listing of all predicted driver mutations meeting your search criteria.
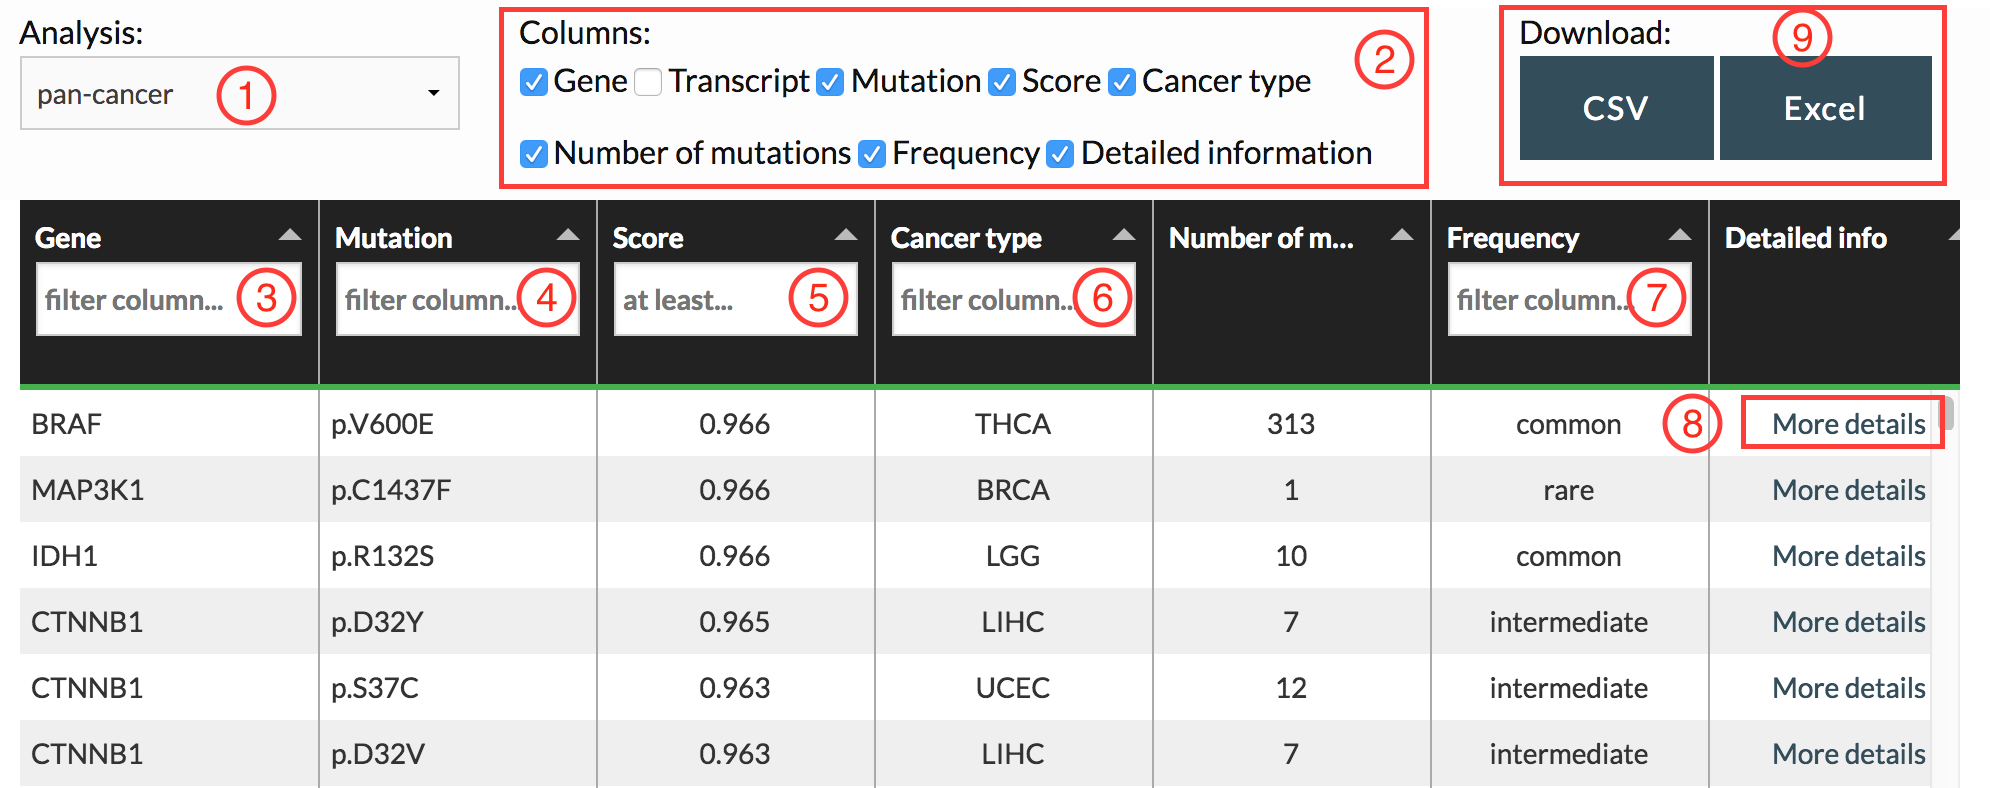
Analysis type:
We performed analysis with CHASMplus in two different manners. The first called “pan-cancer” aggregates mutations from multiple cancer types together, while the second was done by analyzing each cancer type separately (“cancer type-specific”). You can select which analysis you want to examine by using the dropdown menu (see Marker #1).
In the case of the pan-cancer results where multiple cancer types contain the same mutation, the listed cancer type has the highest mutation frequency.
Toggle columns:
You can toggle the display of columns by checking/unchecking boxes (see Marker #2).
Search capabilities:
You may enter multiple combinations of searches by using the advanced searches available on the table.
- Filter by gene name (exact match, see Marker #3)
- Filter by mutation (fuzzy match, see Marker #4)
- Filter by mutations with at least a certain CHASMplus score (see Marker #5)
- Filter by cancer type (see Marker #6)
- Filter by the mutation frequency of the driver mutation (common, intermediate, or rare, see Marker #7)
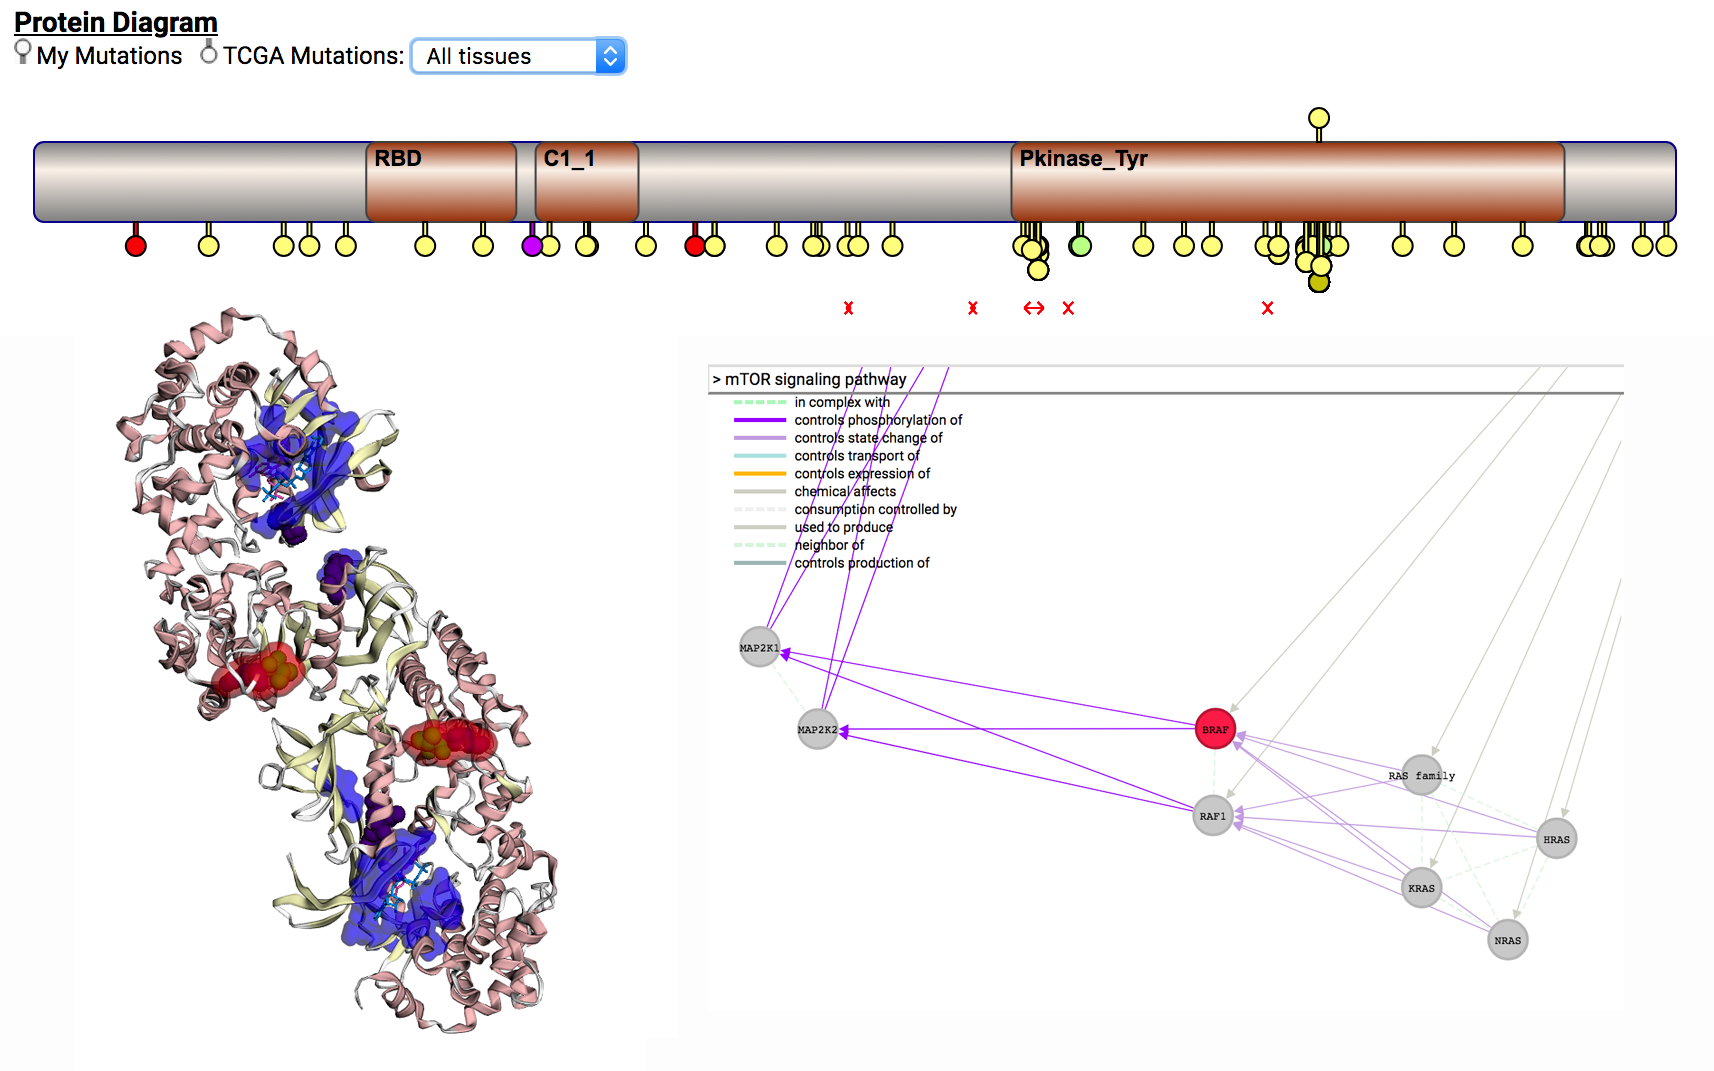
Additional variant information:
By clicking on the “More details” link for each variant (see Marker #8), CRAVAT provides more information on the variant, including a lollipop plot, protein structure viewer and gene network graph. You can read help about using these widgets from the CRAVAT and MuPIT help pages.
Download data:
You can download data in either excel format (.xlsx file) or as a csv file (see Marker #9). You can also download the complete list of TCGA patient IDs used in this analysis here.